http://kelseyherritt.blogspot.com/2011/04/triangular-plot.html
A triangular plot is able to represent three different variables.
Map Catalog
Thursday, April 17, 2014
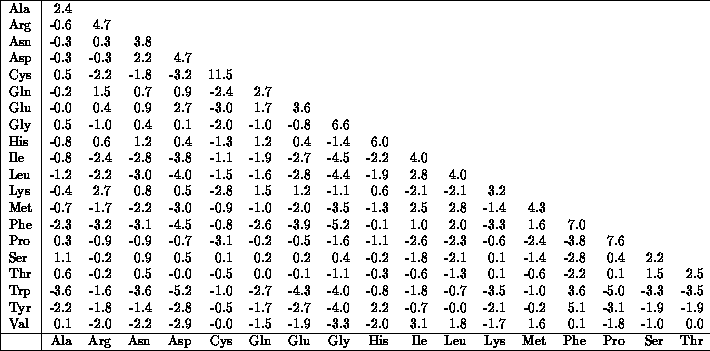
similarity matrix
http://mendel.ethz.ch:8080/Server/ServerBooklet/section2_14.html
A similarity matrix is a representation of scores that shows the similarity between numerous data points.
Histogram
http://codereview.stackexchange.com/questions/36266/building-an-histogram-array-in-php
A histogram is a chart that uses bars to measure statistics.this histograms shows the ranges of population.
Steam and leaf plot
A stem and leaf plot is a special table where the stem represents the beginning number and the leaf if the ending number who changes the entire number. This plot here shows
Box Plot
This box plot shows the vistors time for each individual. The black dot shows the median visit times
scatterplot
http://onlinestatbook.com/chapter4/intro.html
A scatterplt is a mathamatical diagram that represents two varaibles. thus particular one shows a wife's age as a function of her husband's age.
A scatterplt is a mathamatical diagram that represents two varaibles. thus particular one shows a wife's age as a function of her husband's age.
Star Plot
A star plot is a method of displaying multivariated data. Also each star represents a single observation. and in the map above it shows a comparison of crime rates in cities in the U.S.
Subscribe to:
Comments (Atom)


